ExaSAT: An Exascale Static Analysis Tool for Hardware/Software Co-Design
GitHub Project Page
To clone repository: git clone git@github.com:LBL-CoDEx/exasat.git
Contents
- Overview
- ExaSAT Tool Description
- Floating-Point Operations Analysis
- State Variable/Register Analysis
- Array Access Pattern and Working Set Analysis
- Stencil Loop Optimization Analysis
- NVRAM Memory Technology Analysis
- Summary of Design Exploration Impacts
- Publications
Overview
One of the challenges to designing future HPC systems is understanding and projecting the performance of scientific applications. In order to determine the consequences of different hardware designs, analytic models are essential because they provide a mechanism to provide fast feedback to application developers and chip designers before the use of more costly simulation and emulation tools. However, many tools that analytically model program performance rely on the user manually specifying a performance model. Our ExaSAT framework automates the extraction of parameterized performance models directly from source code using compiler analysis. The parameterized analytic model enables quantitative evaluation of a broad range of hardware design trade-offs and software optimizations on a variety of different performance metrics.
Our work has demonstrated the ability to perform deep code analysis of a proxy application from the DOE Combustion Co-design Center to illustrate its value to the exascale co-design process. ExaSAT analysis provides insights in the hardware and software tradeoffs and lays the groundwork for exploring a more targeted set of design points using cycle-accurate architectural simulators. This webpage describes some of the capabilities of our tool and insights we derived from application of the tool to the CNS and SMC Combustion Co-design mini-applications.
ExaSAT Tool Description

The figure above shows the workflow of our framework. The compiler analysis for ExaSAT was built on top of the ROSE compiler framework [1], which is an open-source compiler infrastructure developed at Lawrence Livermore National Laboratory. ROSE parses C, C++, and Fortran source to convert it into an abstract syntax tree (AST) that we can manipulate and analyze. The analysis of the AST queries the procedure definitions (subroutines and functions), identifies local and external variables, determines data liveness, and for each loop in each procedure conducts a detailed loop analysis. The loop analysis handles imperfectly nested loops and gathers loop attributes such as iteration bounds and strides, which are later used by the performance model to reason about the iteration space. For stencil computations, we can analyze the array access pattern to determine data reuse for hierarchical cache hardware models. Maintaining a symbolic representation of the iteration space also enables the performance model to analyze the effect of software transformations such as loop blocking and fusion.
Floating-Point Operations Analysis
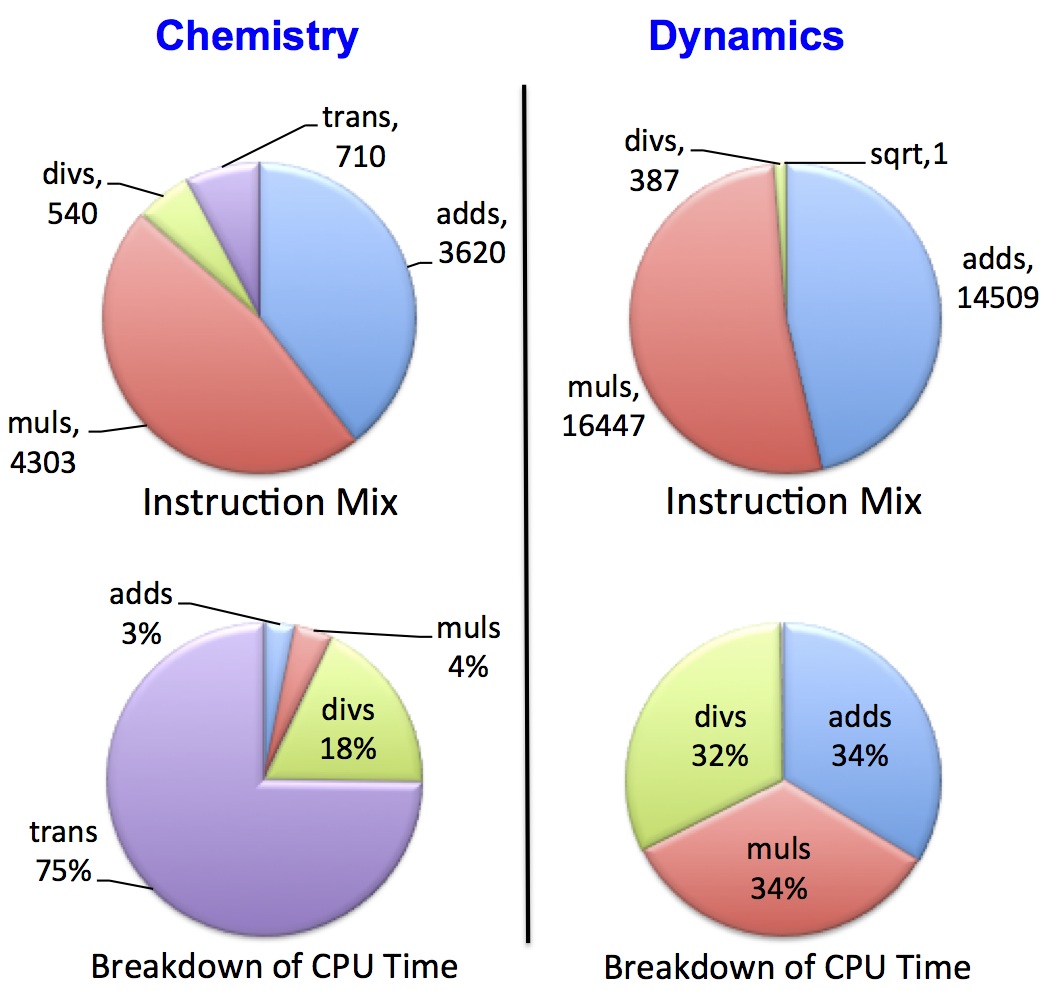
In order to estimate the total arithmetic workload, ExaSAT can extract both floating-point arithmetic (+, -, *, /), as well as special math functions such as exponentials and logarithms in the loop body. We can examine the floating-point operation mix in each loop nest and model their contribution to the simulation’s compute throughput (CPU-only time) by weighting each operation by their cost according to the hardware’s capabilities. The figure below shows our floating-point analysis for both the chemistry and dynamics kernels of the SMC code for a 128-cubed problem size with 53 chemical species. The two kernels exhibit substantially different arithmetic operation distributions. Even though a relatively small fraction of division and transcendental functions appear in the chemistry kernel, these operations can contribute significantly to the running time since they execute roughly one to two orders of magnitude slower on current hardware. Similarly, the number of divisions in the dynamics kernel seems superficually insignificant, but they actually compose one third of the CPU time in our baseline hardware model.
The figure below shows the estimated speedup for the SMC code (including both the chemistry and dynamics kernels) as a result of applying different SIMD lengths in the hardware model. Here the baseline performance assumes vectorized addition and multiplication but scalar division and transcendentals. The figure also shows the estimated speedup for SMC on the Sandy Bridge architecture (indicated as a line) using benchmarked costs for division and transcendentals. Our performance model takes the maximum of CPU time and DRAM time (assumes optimistic overlap) for each kernel independently to compute the execution time.
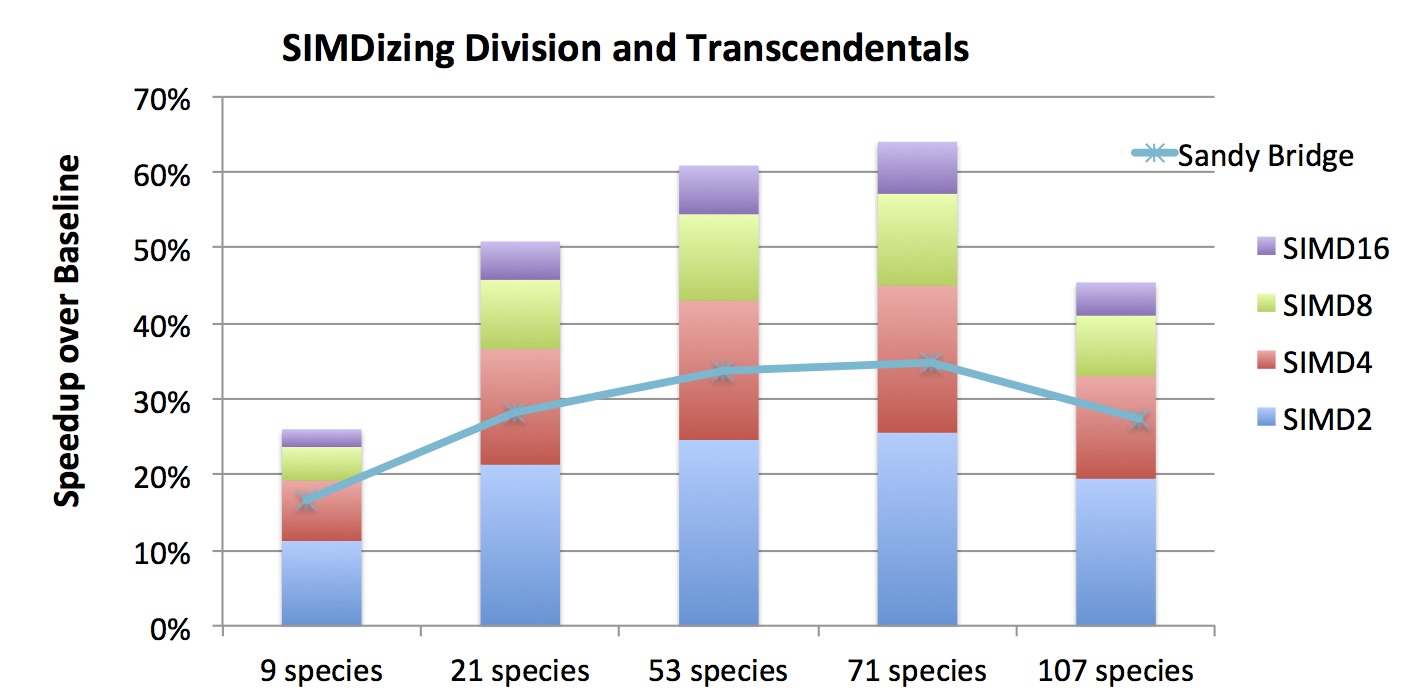
Both vectorized division and transcendentals greatly improve the execution time of the chemistry code; however, there is no benefit for the dynamics code since its execution time is limited by DRAM bandwidth. As a result, there is a diminishing return as we increase the SIMD length. For example, for 53 species, the SSE instruction (SIMD2) provides 25%, while SIMD4, SIMD8 and SIMD16 give 43%, 54%, and 60% improvement over the baseline, respectively. The improvement differs between different number of chemical species because of the number of reactions, thus the number of divisions and transcendentals, differ. Both 53 and 71 species have a high number of reactions per species, which means more arithmetic operations and higher benefit from vectorization for the chemistry component.
State Variable/Register Analysis
The number of accesses to both “state variables” (scalars and non-streamed arrays) and streamed arrays can be used to determine how many registers need to be reserved to hold these values during each of the loops in the program. Since state variables are accessed during every iteration of a loop, an optimal (static) allocation for these variables would place the variables with the most number of accesses into registers, while spilling the rest into the next tier of memory (e.g. L1D-cache or scratchpad). Assuming an architecture with a cache, our performance model can compute the cache traffic that results from spilled state variables based on the hardware model parameters. In addition, it can compute mandatory traffic that results from streamed variable access to estimate total cache traffic. This information is valuable for hardware design evaluation because it exposes a trade-off between available registers and L1D-cache bandwidth.
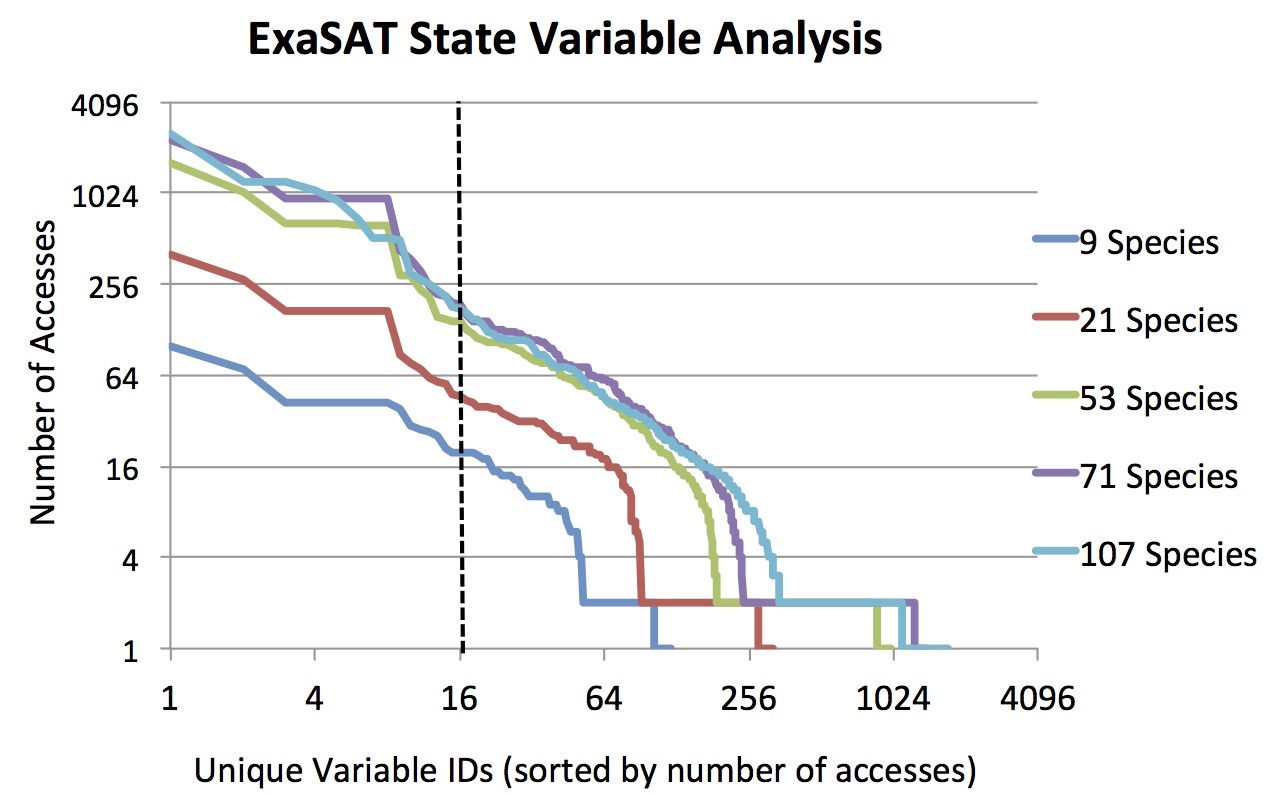
In order to measure how many registers the SMC code requires to avoid spills, our tool collects all the state variables and their access frequencies for each loop using compiler analysis. Based on the number of registers available in the hardware design under evaluation, the performance model allocates state variables to available registers and computes the L1D-cache traffic resulting from the register spilling. The figure below shows the number of accesses for each floating-point state variable sorted by number of accesses in the SMC chemistry kernel. For example, in a 9-species simulation, variable #22 is accessed 15 times. In the best case scenario, the compiler will allocate the variables with the highest number of accesses to available registers. Assuming 16 floating-point named registers (as in SSE or AVX), the vertical dashed line shows the cut-off between variables that would be allocated to registers (left of the line) and those that are spilled to cache (right of the line).
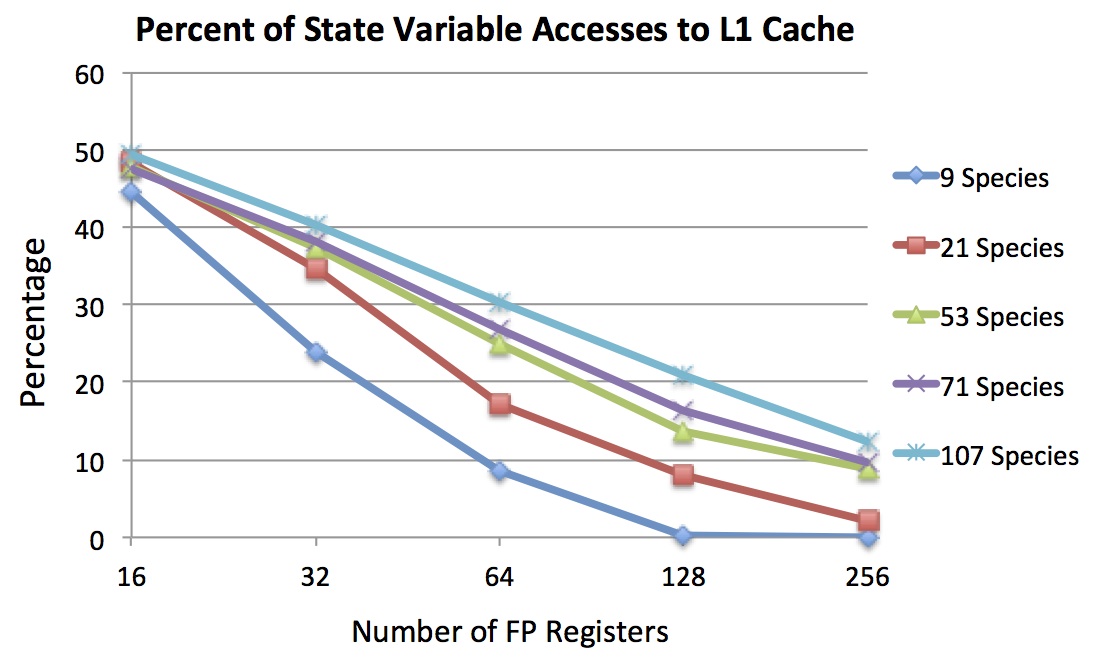
The figure below shows the percent of state variable accesses that are spilled to L1D-cache as the number of registers is varied. In the 16 register example, about half of the accesses are fulfilled from registers and half go to cache for each of the five chemistry species shown. Since the chemistry code has a relatively low streaming data requirement compared to the dynamics code, spilled state variables make up greater than 95% of the L1D-cache traffic in this case. It is possible to filter additional cache traffic by adding registers to the architecture (i.e. moving the vertical line in the first figure to the right). Having 256 registers per thread would filter 88% or more of spilled accesses to L1D-cache for the SMC chemistry code, and 94% or more for the SMC dynamics code. It is important to note that the cost of the spills must be balanced against the cost of a large register file — the optimal performance point may be found by balancing these costs.
Array Access Pattern and Working Set Analysis
Array access analysis is a critical part of the compiler analysis because the read/write properties of arrays are utilized by the performance model to compute on-chip data movement and memory footprint. We classify each of the array variables as read-only, write-only, or both. In order to model data reuse in the cache, we collect information with respect to the array access patterns. We support a model of the working set by examining all the references to an array-component pair in a basic block. The array references are broken into individual subscript expressions to extract their relative offsets to the loop indices. This helps us determine the distance between two references to the same array. Another important property is whether the first reference to an array is a load or a store. If the first reference is a load followed by a store, the load requires the data to be brought into cache from memory before it is written. On the other hand, if a load is preceded by a store, then the load may be carried out from the cache without incurring any additional memory traffic. Our tool conducts the first reference analysis within a loop to more accurately model cache reuse and support the analysis of specialized memory instructions such as cache-bypass loads and stores.
Our cache model currently captures the data reuse pattern that occurs with stencil array accesses. The on-chip memory is modeled as an ideal, fully-associative cache with a least-recently used (LRU) replacement policy. Our model captures compulsory and capacity misses and assumes reuse of data will occur if the working set is small enough to fit in the cache. This provides an optimistic performance bound due to the presence of conflict misses and imperfect replacement in real hardware, though our model should capture the first-order behavior of a finite-cache memory system. In the case of a shared cache, multiple cores on a chip may cooperate to gain the benefit of the larger cache in which to store a shared working set, potentially enabling larger block sizes and reduced memory traffic; however, the overhead of the cache-coherence protocol are not included in our model.
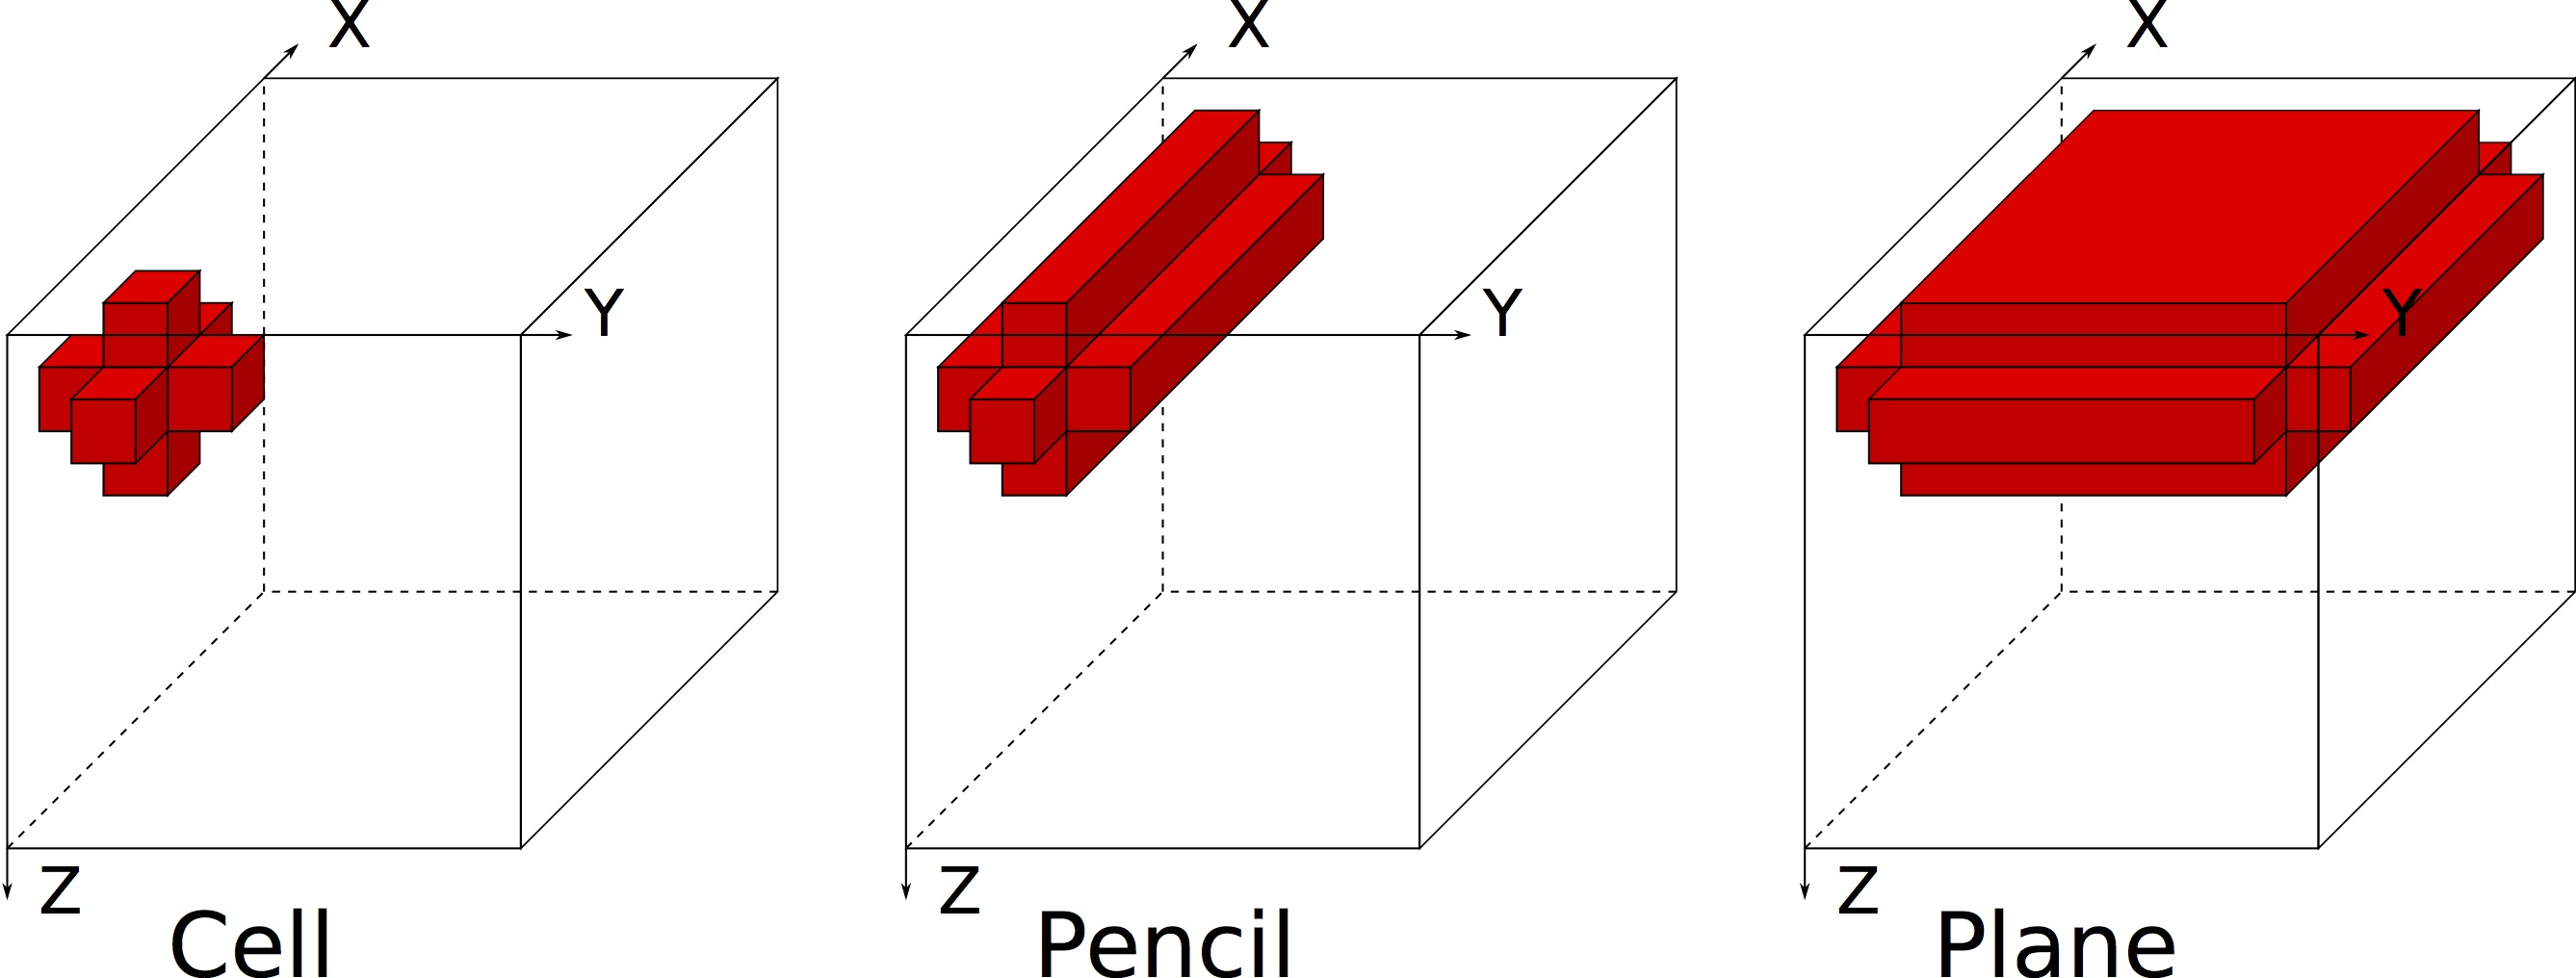
The figure above shows the working set sizes needed to enable reuse between cells, pencils, and planes. If no cache is available, every array access in the kernel requires data to be transferred from further up the memory hierarchy (e.g. from DRAM or a higher-level cache). If the cell working set (left) fits in cache, then those values will remain in cache for reuse on the next cell iteration. Similarly, if the pencil working set (middle) fits into cache, there will be reuse between pencil sweeps, and so forth. Based on the shape of the stencil access pattern (inferred from the array index expressions), our model computes 1) the sizes of the working sets and 2) the resulting memory traffic for each of the reuse cases. This information is then combined with hardware and software parameters to determine the estimated memory traffic and DRAM time required for each array in every loop in the code. For hierarchical cache models, our methodology can be extended to do multi-level analysis that computes bandwidth filtering and performance modeling at each level of cache.
Stencil Loop Optimization Analysis
ExaSAT provides the capability to analyze the impact of two software transformations for stencil loops, cache blocking and loop fusion, to reduce off-chip memory traffic. The first optimization, cache blocking, focuses on reducing capacity misses as a core sweeps through the problem’s iteration space. Blocking (or “tiling”) the iteration sweep reduces the size of the working set required to enable temporal reuse of data. If the working set is reduced to within the size of available on-chip memory, capacity misses can be reduced or eliminated, potentially decreasing the necessary memory traffic between the CPU and DRAM. A trade-off that occurs when implementing cache blocking is redundant overlapping halo traffic that is transferred from DRAM for each tile. The halo consists of neighboring cells outside of the tile that must be read due to the shape of the stencil access pattern. The left diagram in the figure below shows a single, unblocked tile with halos on the outside the tile. As the tile size is decreased (center and right), the halos of each tile overlap with neighboring tiles (indicated with deeper shading). For any particular cache configuration, a blocking strategy should be chosen that balances the penalty of capacity misses against the overhead of redundant halo traffic. This optimization exposes a trade-off in hardware between cache size and memory bandwidth.

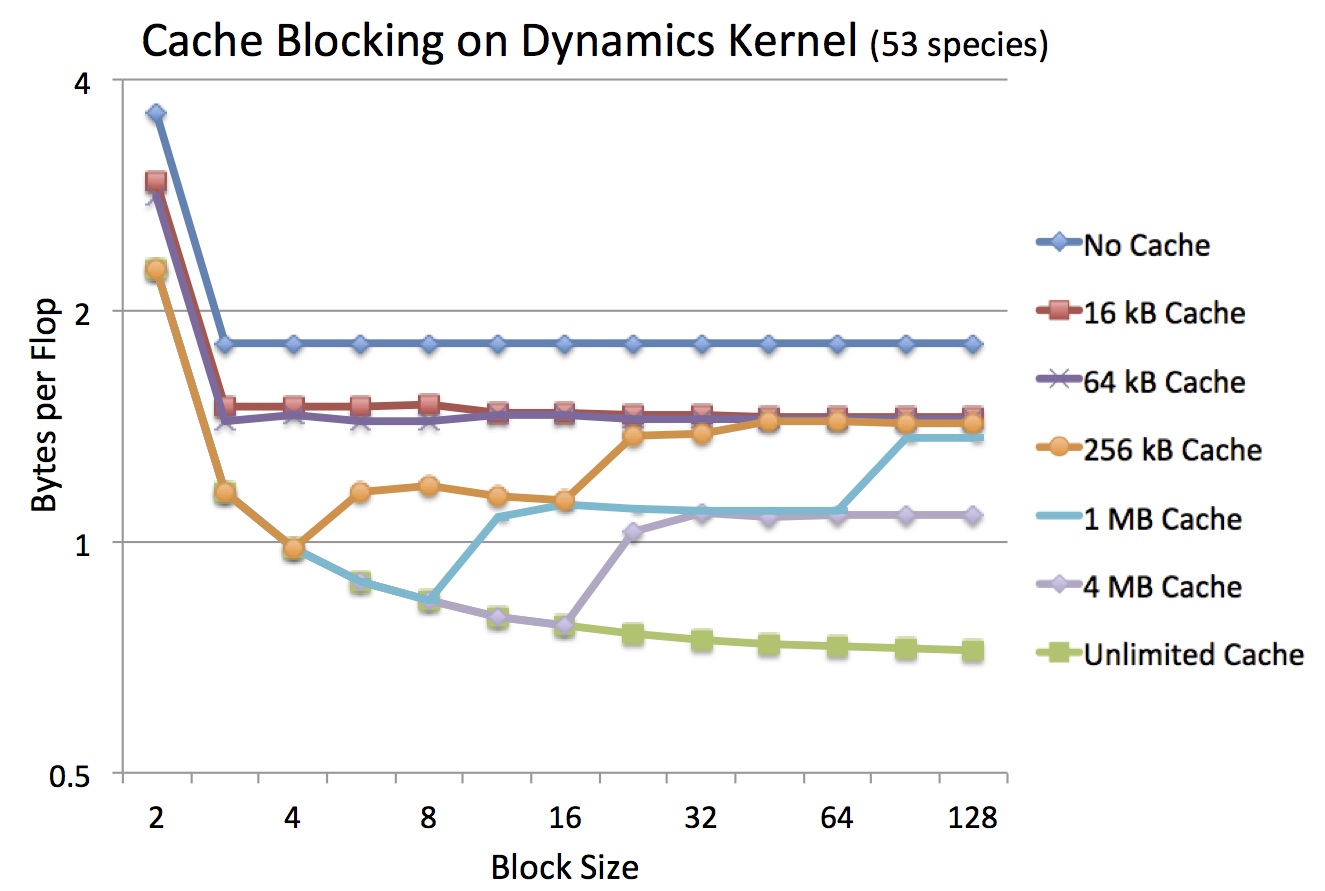
Finding the optimal blocking factor for a given cache size is an optimization problem for compilers, auto-tuners and runtime environments. In this context, ExaSAT can guide other programming tools to reduce to search space for blocking factor. This analysis also illustrates the hardware design trade-off between cache size and memory bandwidth. For each cache configuration evaluated, ExaSAT can help determine the blocking strategy that efficiently utilizes the available cache to reduce the memory bandwidth requirement. The figure below highlights the change in byte:flop ratio (the required number of bytes to be transferred between DRAM divided by the required flops) of the SMC dynamics kernel computed by ExaSAT as a result of blocking for various cache sizes specified by the user.
The second optimization, loop fusion, focuses on reducing the need to stream temporary arrays in and out of memory. While some compilers already implement fusion, they tend to do so to enhance instruction level parallelism and hide latency. In contrast, we apply loop fusion to decrease memory traffic by reducing the number of times arrays are transferred to or from memory. The trade-off for fusing loops is that the register and cache working sets grow, potentially causing a reduction in performance if the working sets no longer fit within on-chip memory. Loop fusion exposes another trade-off in the hardware involving the balance of memory bandwidth with registers and cache size. Our framework allows us to explore the impact of this transformation on memory traffic in the context of varying on-chip memory capacities.
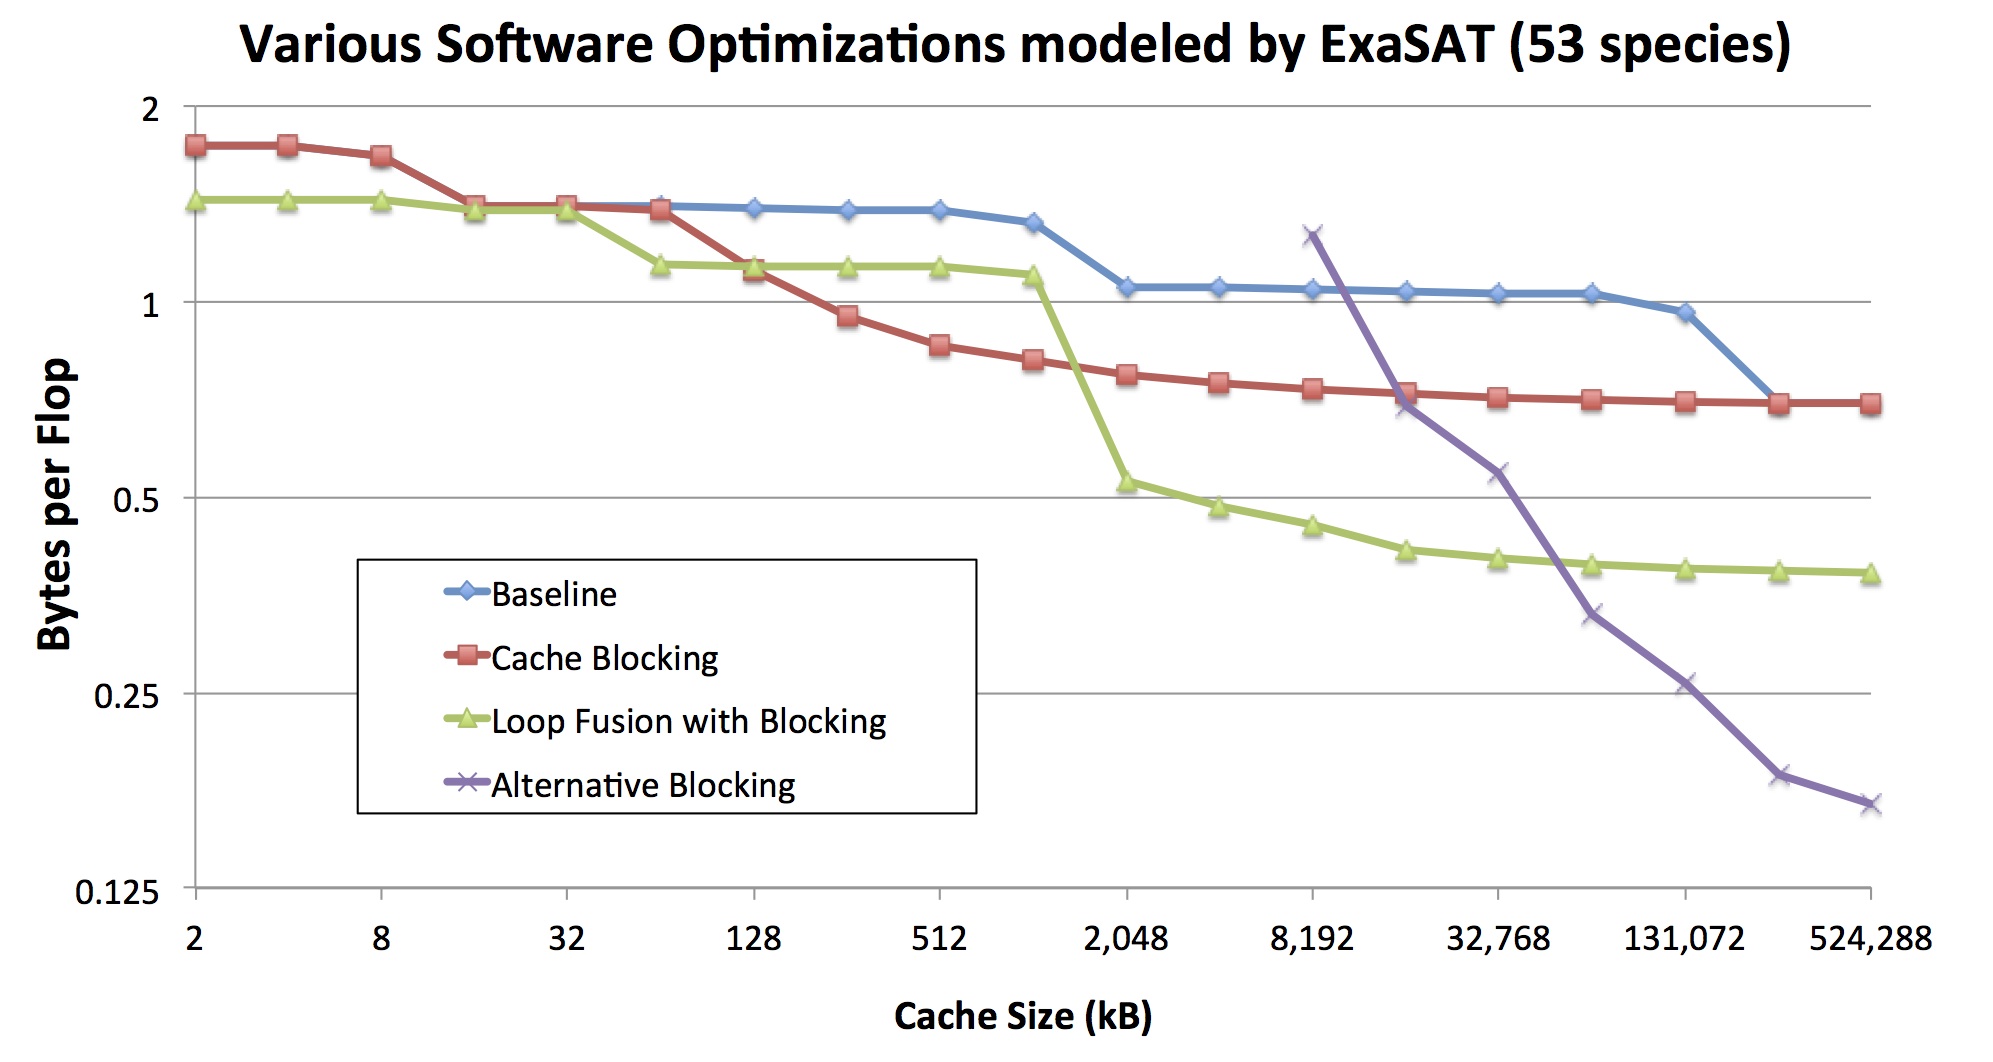
The figure below summarizes the impact of applying various software optimizations on the trade-off space between the hardware’s cache size and memory bandwidth. For small cache sizes, no blocking is used, but there is still some benefit from applying loop fusion to loops that touch the same data. For medium cache sizes, some loops are able to take advantage of reuse within loops in the non-fused case, but there is not enough cache to hold the increased working sets required for fused loop bodies. Once the caches are large enough to contain the increased working sets of the fused loops, fusion becomes beneficial again — for example, the breakpoint is about 2MB with 53 chemical species simulated. For more detailed explanation of our experiments, including a description of the alternative blocking strategies explored, please consult our publications listed below.
NVRAM Memory Technology Analysis
ExaSAT can also analyze the memory usage required for an application. For SMC, the memory requirement increases linearly with the number of species — for example, a 53-species simulation needs 678 three-dimensional arrays, translating into approximately 13 floating point values per species per grid point. Including message buffers and halo regions, a single, standard-size (1283) box in SMC would thus occupy 12.33GB of memory. Exascale memory capacity is predicted to be primarily constrained by cost, which encourages vendors to look for cheaper but denser memory technologies such NVRAM. NVRAM is a cost-effective alternative technology that can serve as a high-capacity, secondary memory by offering higher density and scalability than DRAM while using nearly zero power when in standby mode. On the other hand, NVRAM memory cells tend to have a short lifetime, and the dynamic write energy is 4 to 40 times worse and the write access latency is an order of magnitude slower than DRAM. Nevertheless, without focusing on the details of specific NVRAM designs, ExaSAT can provide array-granularity read/write access metrics to help us determine whether there is sufficient low-write memory traffic for certain arrays to justify inclusion of NVRAM in an exascale node.
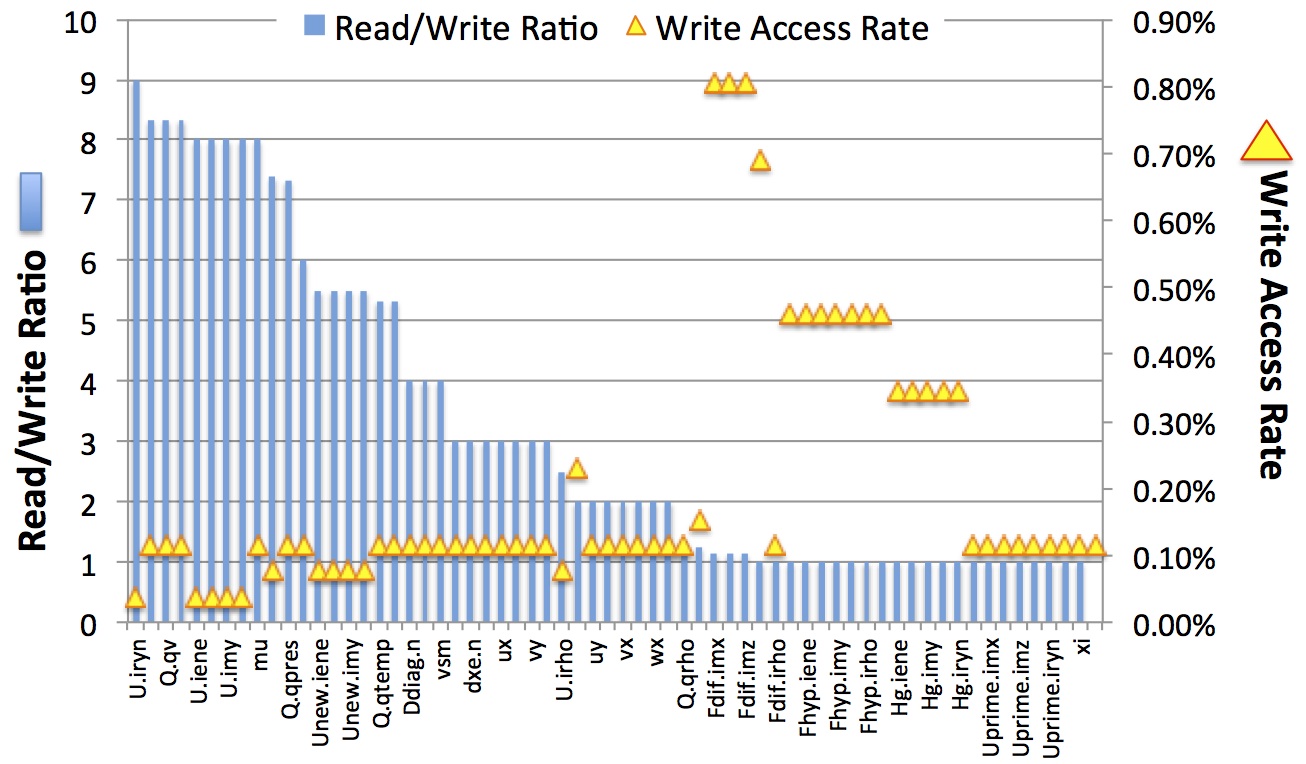
Since writes to NVRAM are costly in terms of both performance and energy, in order to study the NVRAM opportunities in the application ExaSAT can determine the read/write ratio and write access rate of various arrays in the code. In SMC there are a number of arrays with high read/write ratio and low write access rates, so we can choose a cut-off value to decide which arrays to store in NVRAM. The figure above shows that if a write access rate threshold of less than 0.11% is chosen, then a large fraction of data (75%) qualifies for storage in NVRAM. This would translate into roughly 75% idle power savings; however, the dynamic energy for these arrays would go up by a factor of 40. On the other hand, if a conservative read/write ratio threshold of 5 or higher were chosen, the case for NVRAM would be weak because only 35% of the data would utilize it. To assess whether the dynamic energy consumption overshadows the idle energy savings, further investigation using power simulators such as NANDFlashSim can be utilized.
Summary of Design Exploration Impacts
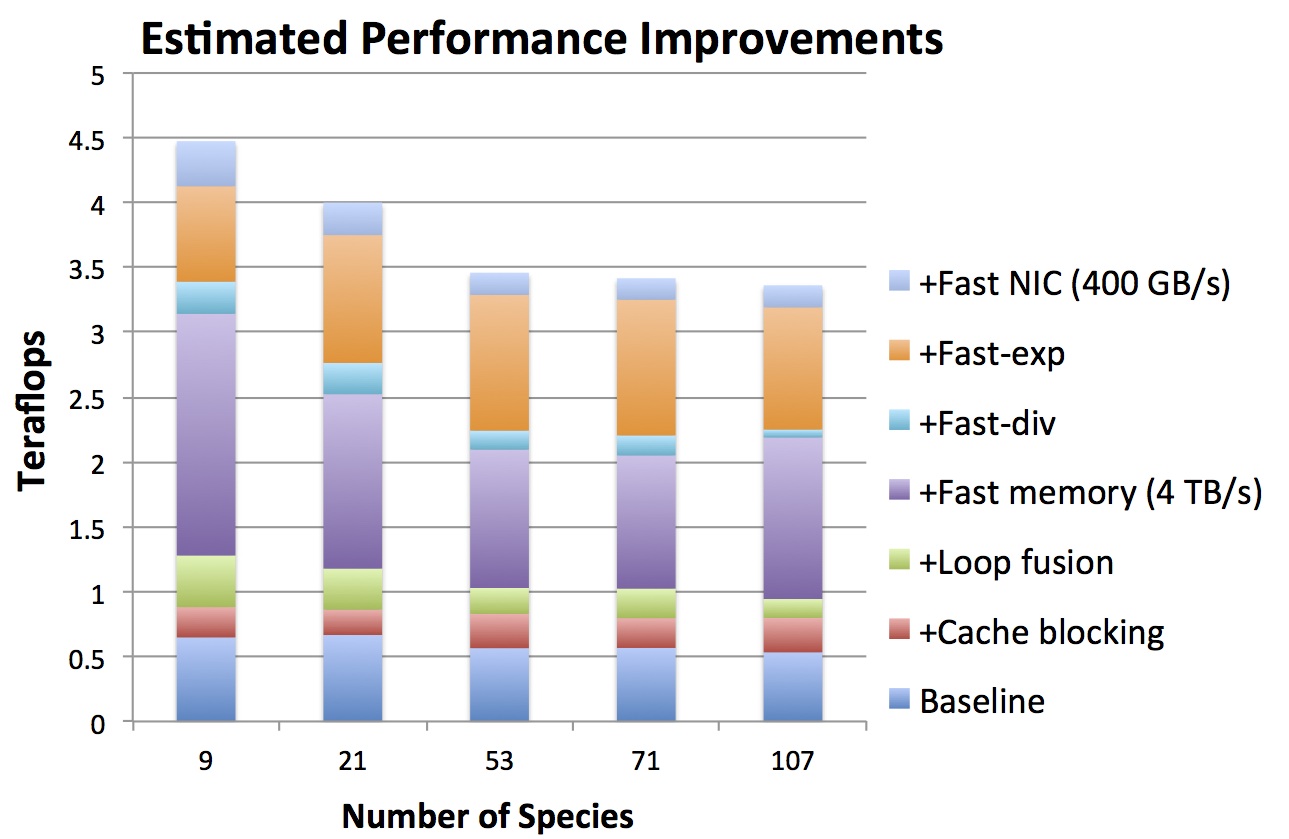
The figure below shows the cumulative impact of the various hardware and software modifications modeled by ExaSAT. The estimated effective baseline performance is slightly over 0.5 Tflops using a 10 Tflop node with 1 TB/s memory bandwidth. The SMC code is severely limited by memory bandwidth. Both cache blocking and loop fusion make more efficient use of memory bandwidth, doubling the baseline performance. However, the estimated performance indicates that software optimizations must be supported by hardware improvements at the expense of increased cost and power for the sake of higher performance. If the memory bandwidth is increased from 1 to 4 TB/s, ExaSAT suggests that a 2.5-3x speedup in the performance is possible. We also modeled the effect of vectorization of division and exponentials for the SMC code. Fast-div represents the predicted performance improvements as a result of improved throughput (2x) using the SSE instruction and Fast-exp represents the improvement for the exponential function by a factor of 3 with the AVX SVML. While the vectorized division provides a modest performance increase, the chemistry component greatly benefits from the improved exponential function performance. Finally, we changed the network injection bandwidth from 100 to 400 GB/s, which represents a custom NIC that integrates the network controller onto the chip to reduce power and to increase throughput by a factor of 4. Even after the software optimizations and hardware improvements, SMC is still limited by memory bandwidth. In the exascale timeframe, it is unlikely that machines will support bandwidths higher than 4 TB/s, thus more aggressive software optimizations will be needed to reduce data movement and deliver the performance improvements necessary to reach exascale.
Publications
- Didem Unat, Cy Chan, Weiqun Zhang, Samuel Williams, John Bachan, John Bell, John Shalf, “Exasat: An Exascale Co-Design Tool for Performance Modeling,” International Journal of High Performance Computing Applications, 29(2):209–232, 2015. [pdf]
- Cy Chan, Didem Unat, Michael Lijewski, Weiqun Zhang, John Bell, John Shalf, “Software Design Space Exploration for Exascale Combustion Co-Design”, International Supercomputing Conference (ISC), Leipzig, Germany, June 16, 2013. [pdf]

